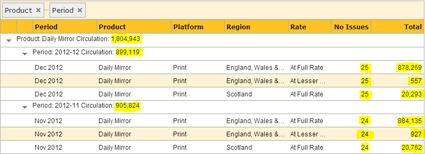
ABC QuickView has a number of calculation options. These enable you to have a greater insight in to trends and averages. Changing the calculation method will affect both the grid and the charts. To see the effect in the grid you must use the drag and drop grouping feature. It is important to understand which calculation method is being applied. The method is always displayed on the calculation button.
Simple Sum
The sum of the 'Total' column for all applicable rows

In this example 899,119 is the direct sum of the three figures for the Daily Mirror. Ie. 878,269 + 557 + 20,293 = 899,199
The 1,804,943 figure is the sum of the 899,199 plus the 905,824 which is the sum of the other grouping.
Simple average
The 'Simple sum' above divided by the number of applicable rows

In this example 299,706 is the sum of the three figures for the Daily Mirror divided by the number of figures (3).
Ie. (878,269 + 557 + 20,293)/3 = 299,706
No. Issues Weighted Sum
The 'Total' in each row multiplied by the 'No Issues' in each row, then all rows summed.

In this example 22,477,975 is calculated by summing the number of issues times the total for each of the three rows.
ie. (25 x 878,269) + (25 x 557) + (25 x 20,293) = 22,477,975
No. Issues Weighted Avg
The 'Total' in each row multiplied by the 'No Issues' in each row, then all rows summed, then divided by the sum of all 'No Issues' column.

In this example 300,801 is result of each rows total multiplied by the number of issues, summed and then divided by the total number of issues.
Ie. (25 x 878,269) + (25 x 557) + (25 x 20,293) + (24 x 884,135) + (24 x 927) + (24 x 20,762) = 44,217,151 / (25 + 25 +25 +24 +24 +24) = 300,801.